"Why am I always broke?" Game currency UI that shows income, upgrade effects and three more readouts
Five game currency UI readouts side by side: an income breakdown, a live rate, before-and-after upgrade previews, price reasons and a preview of where a choice leads.
What we asked“Make a web page that demonstrates the readouts that let players see their game's economy one at a time, so anyone can see and feel each one within a few seconds. For each one, show the same short moment side by side: without it on the left, with it on the right, playing in a loop, with a caption that says what just happened and a replay button. Where it helps, let me play the moment myself. It will sit inside a blog post about 720 pixels wide, so it has to look good at that width and on a phone. Also make each one viewable alone with ?trick=<id>&solo, using these ids: income-breakdown, live-rate, before-after, price-reason, choice-preview. Use one small shop or colony economy for all five, where the left side shows only a wallet number and bare prices. Use the internet freely for better results: free CC0 art, fonts or small libraries (for example Kenney's CC0 assets) are welcome; download anything you use into this folder so the page works without outside links, and list each item with its licence and source in CREDITS.md.”
What happened
- Loaded the economy-readout skill
- Found Kenney's Tiny Town and Tiny Dungeon art on OpenGameArt, because kenney.nl hides its download links, and the Fredoka font
- Wrote one small market-stall economy and five demo cards, each with a scripted loop and a Try it mode
- Checked the page at 720 px and phone width, with no console errors and no sideways scrolling
- Gave two separate testers screenshots, one of the right sides only and one of the left sides only, and asked them the skill's five questions
- Checked that the breakdown always adds up to the wallet's real change
The wallet goes down every day, and the player doesn’t know why. Is it wages? Repairs? Was that upgrade worth it? Players can’t manage money they can’t see, and “I’m always broke” usually means “I can’t tell where my money goes”. Every demo below uses the same small market stall: an orchard, a beehive, two workers, a shop, and a wallet that slowly drains by 16 a day. The left side shows only the wallet number and bare prices. The right side turns on one readout. Try it lets you play the moment on both sides at once: run days, hire or let workers go, buy upgrades.
1. Income breakdown
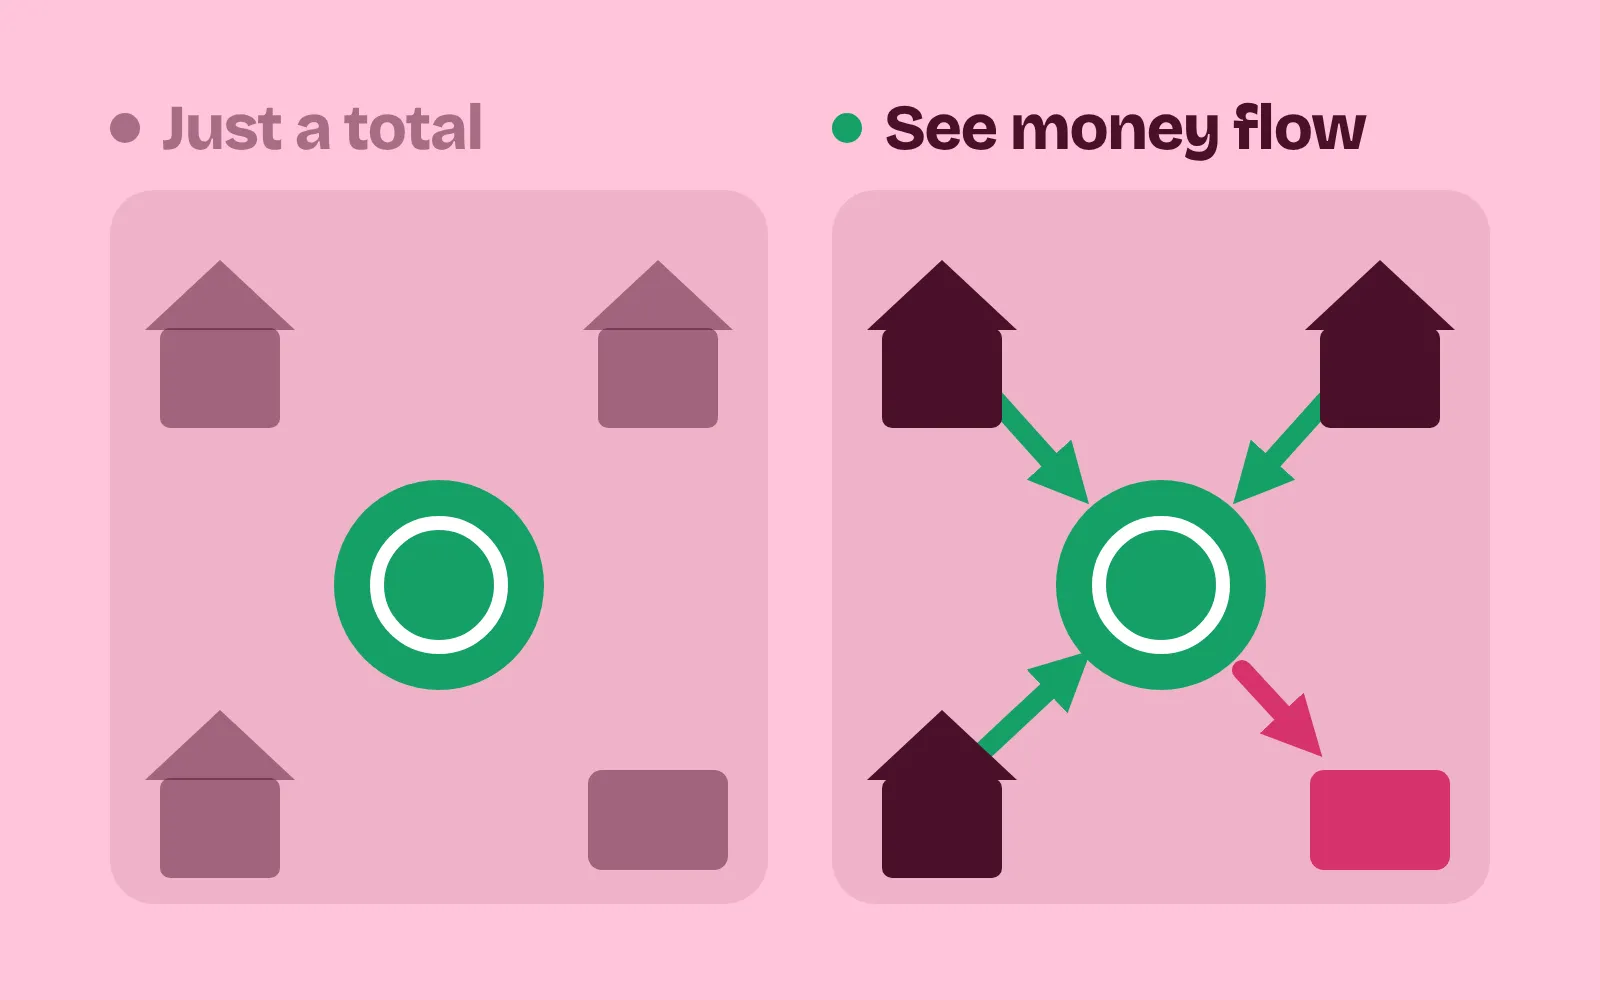
One tap on the wallet opens a panel with every source and every cost, per day (or per minute, or per turn). Bonuses and penalties are signed lines, the biggest come first, and the net total at the bottom matches what the wallet really does. Factorio’s production statistics window shows how fast every item is made and used, with graphs over time (Factorio Wiki). In our demo, a day runs and the wallet goes from 120 to 104. On the left, that’s all you see. On the right, wages (-40 for 2 workers) sit at the top, and the net line shows -16 a day. Over 5 minutes of simulated play with five different setups, the breakdown’s total always equalled the wallet’s real change.
2. Live rate
Put the net rate right next to the wallet (“+4/day”, red when it’s negative), and float each gain or cost up from the thing that caused it: coins from the trees, the hive, the workers, a cost from the broken tools. Now players see where money comes from without opening anything. In our demo, the player lets one worker go. On the right, the rate flips at once from a red -16/day to a green +4/day. On the left, you would have to watch a whole day to find out.
3. Before and after
Next to every price, show what it will change, from today’s number to the new one: “Honey 18 → 30 (+67%) · Net -16 → -4/day”. Diablo III’s item comparison sums stats into summaries like Toughness and Recovery; Blizzard said these “help shine a light on how each stat contributes to your character’s overall power” (quoted by GameBanshee). In our demo, the pointer checks the cheapest upgrade first, “Hire a picker” for 60. It looks like a deal, but the preview shows net income getting worse, -16 → -24 a day, because the picker’s wage costs more than the extra apples. So it buys the Bigger hive for 80 instead: -16 → -4 a day.
4. Price reason
Wherever a price appears, show how it was built: the base value, then each modifier in plain words. RimWorld’s colony sells at 60% of market value and buys at 140%, and you can hover a price in the trade window to see the modifiers behind it, according to the fan wiki (RimWorld Wiki). In our demo, a crate of apples sells for 18 one day and 27 the next. On the right: market value 30, sell rate 60% (-12), apples scarce +20% (+6), trader is a friend +10% (+3), so you get 27. Buying the same crate back costs 45. In Try it, you can switch each modifier on and off.
5. Choice preview
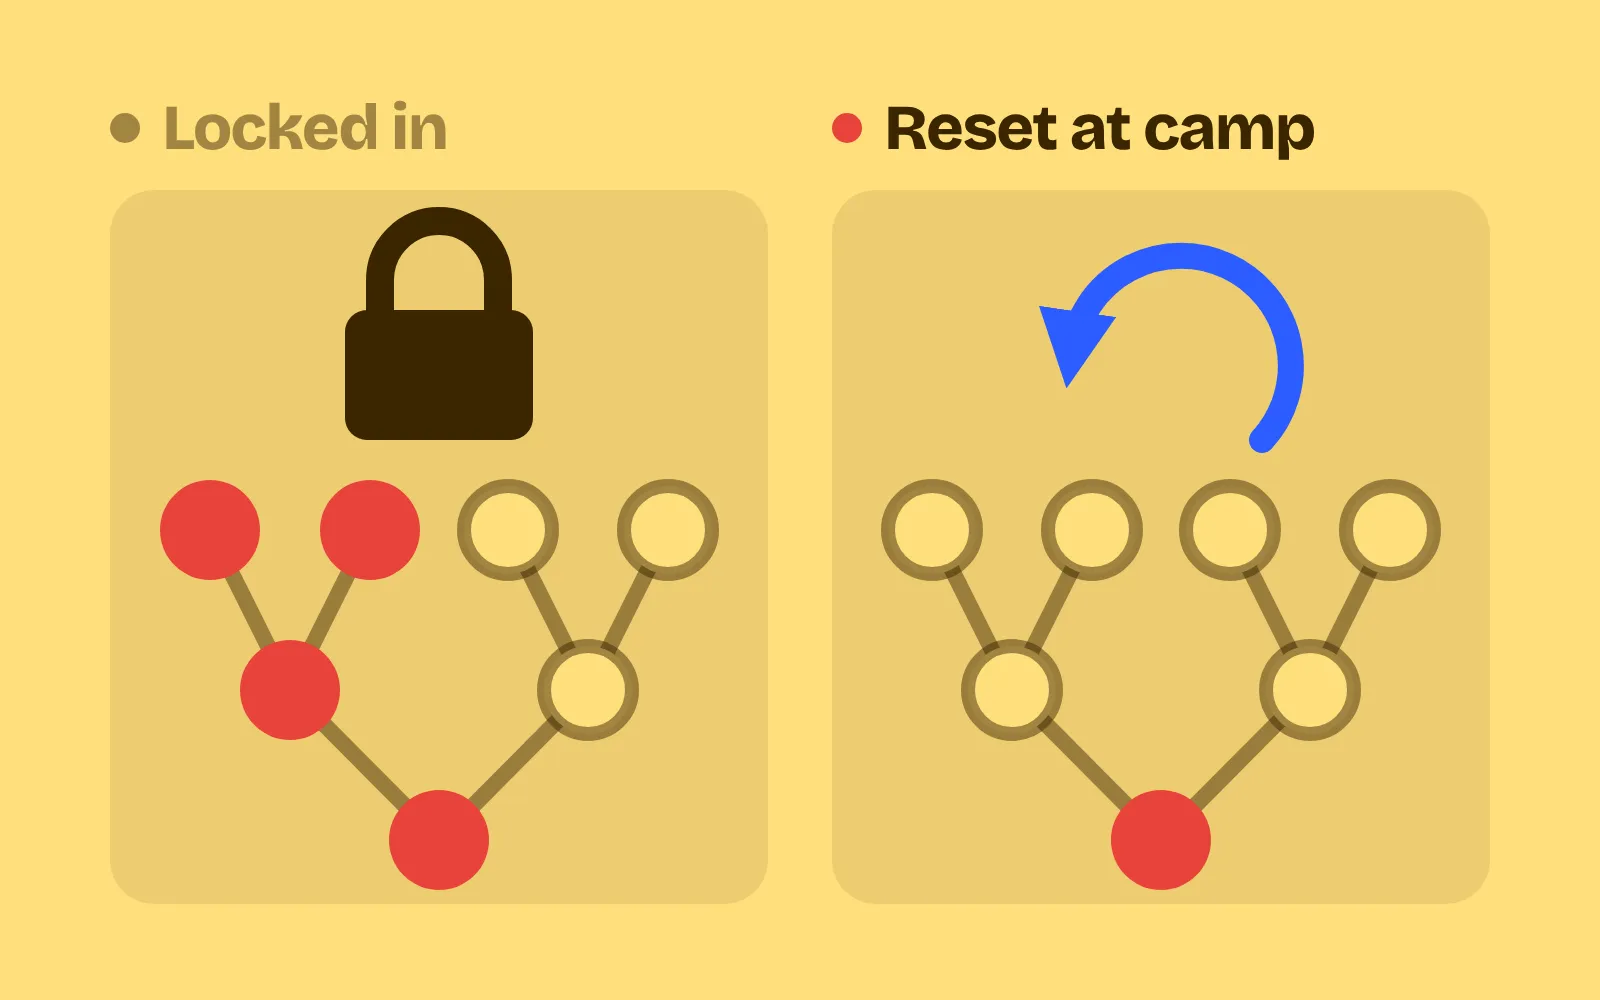
Before a choice locks in for good, show where it leads: the next two steps, what it rules out, and what it does late in the game. Slay the Spire shows the map of a whole act when the act starts, and every route ends at the boss, whose image is the map icon (Slay the Spire Wiki). In our demo, the town council offers a sawmill or a beekeepers’ guild, and neither can be undone. The right side shows that the sawmill leads to a lumber yard (day 8) and a shipyard (day 20), cuts down the orchard (apple sales -30 a day, no apple press, ever), earns +70 a day by day 30, but sinks to -148 first. The player picks the sawmill, and the orchard disappears. Only the left side is surprised.
Don’t bury the player in numbers
A readout should answer a question, not add a spreadsheet to your game:
- Test it with five questions. Show someone the screen and ask: what is my income, what is my biggest cost, what will this upgrade change, why does this cost that much, and what does this choice lock out? In our test, a tester answered all five from the screens with readouts, and none from the screens without.
- One tap away is fine. The live rate belongs next to the wallet. The full breakdown can wait behind a tap.
- Keep some mystery where it’s the fun. If finding out what a strange item does is part of the game, don’t preview it. Preview the choices that can’t be undone.
If the problem is not that players can’t see the economy, but that they have too much money or too little, see game economy design with currency sinks.
Add it to your game
- Copy the skill at the end of this page into your project.
- Ask your agent: “Players say they’re always broke and don’t know why. Show them where their money goes.”
- Play it, then tune in plain words: “The floating coins are too busy. Show only the big ones.”
Art in the demos: Tiny Town and Tiny Dungeon by Kenney (CC0), and the Fredoka font by the Fredoka Project Authors (SIL Open Font License).
The skill that made it work
This is the whole skill we gave Claude Code. Copy it into your project and ask your agent to show players where their money goes. The last step makes it test the screen with five questions and check that the breakdown adds up to the wallet.
- Find every place money enters or leaves (sales, wages, upkeep, bonuses, penalties), every price, every upgrade and every choice that can't be undone.
- Put every trick behind one named switch in a single settings object, all on by default, so each can be tested on its own.
- income-breakdown. One panel, one click from the wallet: each source and each cost per minute (or per day or turn), bonuses and penalties as signed lines, and a net total that matches what the wallet really does. Biggest first.
- live-rate. Show the net rate next to the wallet ("+42/min", red when negative), and float each gain or cost from the thing that caused it, so players see where money comes from and goes.
- before-after. Next to every price, show what changes: "Income 12/min → 15/min (+25%)", "Damage 40 → 52". Diablo III's item comparison sums stats into Damage, Toughness and Recovery.
- price-reason. Where a price appears, show how it was built: base value, then each modifier in plain words ("sell rate 60%", "demand high +20%", "friend discount -10%"). RimWorld sells at 60% and buys at 140% of market value, and lists the modifiers in the price tooltip.
- choice-preview. Before a choice locks in, show what it leads to: the next two steps of the tree, what it rules out, and its effect late in the game. Slay the Spire shows a whole act's map, boss included, at the start of the act.
- Measure it. Show a fresh player or a separate agent the screen and ask: what is my income, what is my biggest cost, what will this upgrade change, why does this cost that much, and what does this choice lock out. Report correct answers out of five and seconds per answer, and check that the breakdown's total equals the wallet's real change over a minute.
Save it as .claude/skills/economy-readout/SKILL.md in your project. Or connect your agent and type /aigamedev: it loads this skill with its reference files and the results from this post.